Market Analysis for next week
- Yash Mehta

- May 1, 2021
- 5 min read
Updated: May 8, 2021

In the last week's Market Analysis I have told that Market is offering low risk buying opportunity for traders. One can read the blog by clicking on highlighted text. There were multiple reason for buying: Index Trading near Demand Region, RSI Bullish Divergence. Nifty was at 14341 at that time and in this week Nifty made high of 15044 (5% up) in a week and closed at 14631 (2% up) whereas BankNifty was at 31722 and it made high of 34287 (8% up) and closed at 32781 (3.3% up). Also, some of the stocks were shared for short term and their performance in this week was:
Reliance, Axis Bank and ICICI Bank gave good returns whereas others have taken some of our gains. Net we made returns of 13.3% in these 7 stocks.
Market was very volatile in previous week where we have seen a straight upmove for first three days and down move for remaining two days. Axis Bank and ICICI Bank have given good returns although we didn't know that results were there, but we picked those stocks on the basis of Technical Analysis and made decent returns. For the same purpose, I have started an initiative of writing a series of blogs on Technical Analysis where I will cover from Basic to Advance levels. One can master this simple art of Technical Analysis by reading these blogs and practicing daily.
Readers can checkout and read first three blogs of Technical Analysis here:
Now let's see what can happen in Nifty, BankNifty and broader market for next week. Some charts of the constituents are also shared at the end as a bonus for all the readers, so read till the end.
Nifty
Starting with long-term chart or higher time frame (Weekly Chart)

This is the same chart that we saw last week and analysis of this remain same. Since it is weekly chart so analysis of this won't change daily or in the short term.
Nifty weekly chart is still in uptrend and it didn't form lower lows or broke previous low yet. Positional Traders and Investors can still hold their position and try to use the opportunities to average or pyramid your position.
As long as we are above 13600 and Nifty doesn't close below 13600, there is nothing to worry. Weekly closing below 13600 will be a trigger for bulls to exit.
Let's look at a daily chart of Nifty and analyze what price action says.

Last week we studied about Supply and Demand and this week Nifty followed that perfectly. We were trading near Demand Zone last week and price of Nifty went up 750 points from those levels in three days. Then Nifty faced resistance exactly at Supply Zone and Nifty went down by 400 points in two days. If Nifty comes down back to Demand Zone, then it would be time to buy stocks for swing trade. In the short term, if NIfty closes below that demand zone (14200) then short-term trend will become weak.
Support and Resistance Levels:

Some of the crucial Support and Resistance Levels marked for Nifty. One need to check and wait for the breakout or breakdown from those levels (14990, 14700 and 14520). Always wait for the confirmation by waiting for the closing basis price.
Fibonacci Levels:

In this upmove, Nifty had taken support exactly at 50% retracement level. If Nifty takes support at 61.8% and stays above that level, then uptrend will continue.
Now let's see BankNifty chart.
Starting with long-term chart or higher time frame (Weekly Chart)

BankNifty weekly chart is still in uptrend and it didn't form lower lows or broke previous low yet. Positional Traders and Investors can still hold their position in Banking stocks and try to use the opportunities to average or pyramid your position.
As long as BankNifty doesn't close below 29000, there is nothing to worry. Weekly closing below 29000 will be a trigger for bulls to exit.
Let's look at a daily chart of BankNifty and analyze what price action says.

As updated in previous analysis that this breakdown was fake and BankNifty had given closed above trendline and if it sustain above that, then short sellers will get trapped. This is what we have seen in BankNifty upmove last week. Again 31700-31900 would be a good support region for BankNifty on daily time frame.
Fibonacci Levels:

In fibonacci; 61.8% retracement comes at 31900 and it will serve as a good support for BankNifty. It matches with our trendline support region of 31700-31900.
Let's look at an interesting pattern in BankNifty on hourly time frame now:

After this downtrend from 37000 to 30000; BankNifty is forming Inverse Head and Shoulder reversal pattern. Its bullish pattern and if it closes above 34000, then first target seen is 37600. One can start buying Banking stocks or BankBees now and add more after final confirmation.
Let's see some chart of Nifty 50 and BankNifty constituents.
ITC (Daily)

Taking support near Demand Zone for the second week. Low risk buying opportunity.
HindUnilvr (Daily):

Taking support at trendline for the second week. Low risk buying opportunity.
Dabur (Daily):

Previous Supply Zone has become Demand Zone for Dabur. Currently trading near that region and offering low risk buying opportunity.
Reliance (Daily):

Reliance trading near Supply Zone. One can start buying small quantities and wait for confirmation above 2055. First Target is 2225 in the short term.
Bharti Airtel (Daily):
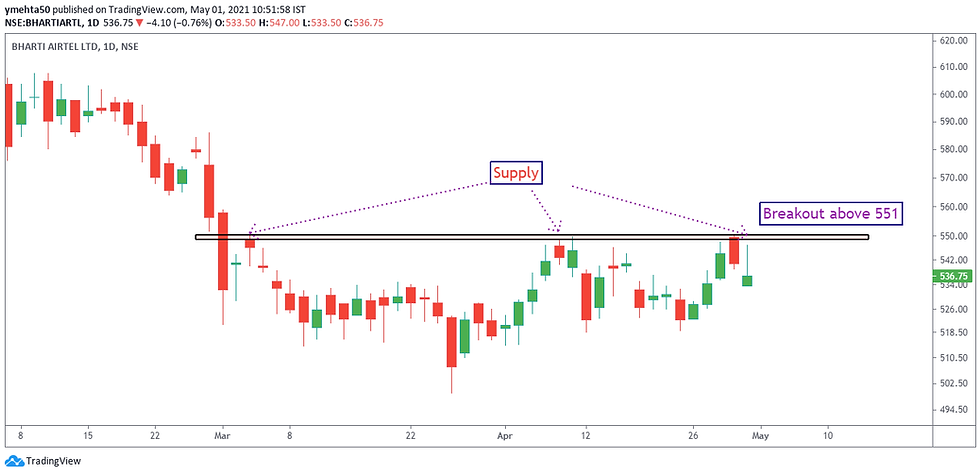
Airtel facing resistance at Supply Region. Wait for the breakout above 551. First Target is 600.
Kotak Bank (Weekly):

Kotak Bank taking support at Supply (Pre Covid High) turned Demand Zone. Currently offering low risk buying opportunity for positional traders.
SunPharma (Daily):

Trading near Supply Region. Wait for the breakout above 661. First target can be 755. Stop Loss: 630
Divis Lab

Divis Labs gave breakout above Supply Zone after 5 months. Short-term traders can track this for the target of 4600. Stop Loss: 3700. Buy on dips.
I am sharing these charts only for study purpose. One can track these stocks for short term or long-term perspective. Planned your trade with proper stop loss and target and then take action.
Also, if you have any chart that we can track then share it with us in the comment section.
Conclusion:
Currently, market is volatile, and it is seeing big moves in intraday as well. Market is still buy on dips and some of the stocks that I have shared are giving excellent risk reward for the traders. Keep stop losses intact only this can save you from big disaster and the loss is certain in the market.
If there is something that I can improve upon, then please suggest that too so that I can create true value in this our Market Analysis.
Thanks for giving your precious time in reading this blog. I hope I have added value to your market analysis for next week. Like and Share with others too if we can create value for others


Good Analysis, Thanks
Even paid membership doesn't explain at this detail level. Great blog and huge knowledge gain for us.
Nice one Yash, Much appreciated your time and knowledge to share a valuable content like this. Extremely insightful
Good research
Thanks for the post