

Market analysis for next week
- Yash Mehta

- May 15, 2021
- 5 min read
Updated: May 22, 2021

In the last week's Market Analysis we have told that market is approaching its resistance/supply zone and it's time to stay cautious. Supply Zone was (14960-15050) and Nifty touched high of 14966 and then went down 370 points. Nifty was down by 1% and BankNifty was down by 2.2% this week.
Snapshot of the conclusion of last week analysis.

Keep your analysis simple and follow your trade plan. I have shorted Nifty call options when it was at supply zone and all options became OTM or 0.
Also, some of the stocks were shared for short term and their performance in this week were:
Net we made returns of 0% or flat in these 8 stocks.
Some of the major news and events that happened in this week are:
Click on the news and it will redirect you to the article.
Now let's see what can happen in Nifty, BankNifty and broader market for next week. Some charts of the constituents are also shared at the end as a bonus for all the readers, so read until the end.
We won't be looking at weekly chart as the support is currently far from current market price.
Nifty weekly support is 13600 and BankNifty weekly is 29000.
Nifty
Daily time frame chart:

Nifty is trading in this Demand and Supply range for almost 2 months now. Best strategy a trade can use is to buy stocks for the short term when Nifty is at Demand Zone (14160-14250) and keep closing basis stop loss below demand zone. Then exit all the short-term trades when Nifty is trading at Supply Zone (14960-15050). This is 2 months consolidation and if breakout above supply region or breakdown below demand region will trigger sharp one sided move in that direction.

On daily time frame, Nifty is forming a triangular pattern, and it is trading in between support and resistance trend line. For next week, watch out for breakout above resistance line (14930) or breakdown below support line (14330). If this range breaks, then one can expect 2300 points move in Nifty in the direction where it breaks. I will be closely watching this out and then plan my trade being a directional trader. Wait for closing basis confirmation.
Fibonacci:

If we consider uptrend in Nifty from Budget day and connect high and low to arrive at Fibonacci retracement then we can see that Nifty is facing strong resistance at 23.6% level which is around 15000. If Nifty closes below 61.8% levels (14297) then this uptrend in Nifty will change in short term.
Last week strike mentioned for call and put option writers based on support and resistance have expired OTM. The option writer would have got full premium as a profit.
I have started YouTube channel and video on next week option writing is uploaded there. Please check that out to know the analysis and trading plan.
Do check this out: Option Writing Plan for 20th May Expiry
Trading plan and analysis will be shared every Thursday so like, share and subscribe this channel so that you all can get notification.
Currently, nothing can be said for Nifty because of consolidation. This is silence before the storm and we will have to wait for this range to break.
BankNifty
Let's look at a daily chart of BankNifty and analyze what price action says.

On daily time frame, BankNifty is forming a triangular pattern, and it is trading in between support and resistance trend line. For next week, watch out for breakout above resistance line (33270) or breakdown below support line (31600). If this range breaks, then one can expect 8700 points move in BankNifty in the direction where it breaks. I will be closely watching this out and then plan my trade being a directional trader. Wait for closing basis confirmation.
Fibonacci:

BankNifty is in downtrends that's why I have plotted Fibonacci retracement from high to low. 61.8% levels which is 34918 can be a major hurdle for BankNifty.
Interestingly, both the Nifty and BankNifty is forming triangular pattern that means this consolidation phase will end soon and we will see one sided move soon in upcoming weeks.
Some sectors that are looking good for short term and positional trades are:
Nifty Auto
Nifty Bank
Nifty Fin Service
Nifty Metal
Nifty Pvt Bank
Although market is consolidating and is going down but more sectors are becoming bullish. Because of this I am having a bullish view on market and I am expecting breakout above resistance and a rally.
This view is based on current data, always remember:
"Market is Amoeba and it keeps on changing its shapes as a trader/investor we will have to change along with it."
Let's see some chart of Nifty 50 and BankNifty constituents.
Kotak Mahindra Bank (Weekly):

Kotak Bank is taking support at exact demand zone marked in chart. It's also the previous all-time high for Kotak.
Hindalco (Daily):

Metal sector was in bull run now its correcting. Hindalco is one of the stock that can take support at trendline and demand zone.
Hindustan Copper (Daily):
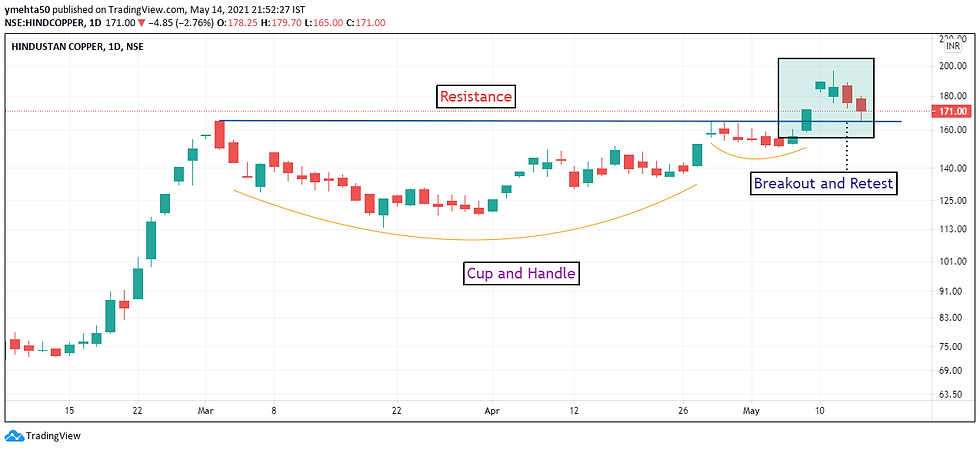
HindCopper is in an uptrend for long time. Currently, it had formed cup and handle continuation pattern. It had taken support exactly at the previous resistance level.
Maruti Suzuki (Daily):

Maruti has given breakout already and now giving opportunities to the buyer to enter.
Hdfc Bank (Daily):

Hdfc Bank trading near demand zone and giving opportunity for short term buy trade.
I am sharing these charts only for study purpose. One can track these stocks for short term or long-term perspective. Planned your trade with proper stop loss and target and then take action.
Also, if you have any chart that we can track then share it with us in the comment section.
Conclusion:
Currently, market is trading in tight range and forming triangular pattern. It's just a silence before a storm and we can expect one sided big move in the direction where it breaks the range.
One can master this simple art of Technical Analysis by reading these blogs and practicing daily.
Readers can checkout and read first three blogs of Technical Analysis here:
We will be published fourth blog on Technical Analysis series tomorrow and a video of more stocks chart analysis on our YouTube Channel so do subscribe for learning videos as well.
We have covered FMCG Sector Analysis, so read that too, and it can help you to understand the business and get an overview of Zomato Business.
If there is something that I can improve upon, then please suggest that too so that I can create true value in this our Market Analysis.
Thanks for giving your precious time in reading this blog. I hope I have added value to your market analysis for next week. Like and share with others too if we can create value for others.

Very well written article. Keep it up!