

Market analysis for next week
- Yash Mehta

- May 29, 2021
- 5 min read

In the last week's Market Analysis we have discussed that market was bullish and we can expect more upside in the market. Also, we were expecting all-time high levels in Nifty and it had achieved this week itself. Now Nifty is trading exactly here that previous all time resistance and broke that level on closing basis on Friday.
Nifty is up by 1.72% and BankNifty is up by 1.54% in last week. Also, some of the stocks were shared for short term and their performance in this week was:
Net we made returns of 11.7% or flat in these 4 stocks that were shared.
I have shared detail technical and fundamental analysis of a non-lending financial stock in this YouTube video. It has immense potential to grow and become a wealth creator for investors.
I am planning a long-term investment in this and will be doing SIP on every dip.
Like and subscribe to our channel as it keeps us motivated to share more informative videos like this.
Some of the major news and events that happened in this week are:
US pips Mauritius as 2nd largest source of FDI in India in 2020-21: DPIIT data
India's forex reserves hit lifetime high, rise $2.8 billion to $592.894 billion
Mahindra to launch 23 new products by 2026, invest Rs 12,000 crore
As Paytm plans to launch India's biggest public issue, here are top 10 IPOs so far
Sun Pharma joins biosimilars race, to target assets with patent expiries in 7-10 years
Tyre prices set to increase due to rising input prices: Apollo Tyres
Click on the news and it will redirect you to the article.
Now let's see what can happen in Nifty, BankNifty and broader market for next week. Some charts of the constituents are also shared at the end as a bonus for all the readers, so read until the end.
We won't be looking at weekly chart as the support is currently far from current market price.
Nifty weekly support is 13600 and BankNifty weekly is 29000.
Nifty
Daily time frame chart:

As told earlier, Nifty had broken its all-time high resistance level and now entered in uncharted territory. I will show some hack on how to trade if price enters in uncharted territory. In the above chart, Nifty had formed rounded bottom pattern and as per breakout we can expect target of 16700 in Nifty soon. This breakout will fail if Nifty gives closing below 15100.
Rounded bottom pattern is formed when the price is in uptrend and it takes a pause for some time. Basically, price consolidates while forming rounded bottom pattern and after breakout price continues its upward journey.
Fibonacci Retracement:

This setup is the hack if price enters uncharted territory. I have plotted high to low for the Fibonacci retracement and I have got some key levels in form of percentage of retracement. In this setup: 23.6%, 38.2%, 61.8%, 78.6%, 161.8%, 261.8% levels are important. Price generally follow this levels. So currently Nifty can face resistance directly at around 16070 levels which is far and bulls have more room to move up. Some live example for this in Nifty chart:
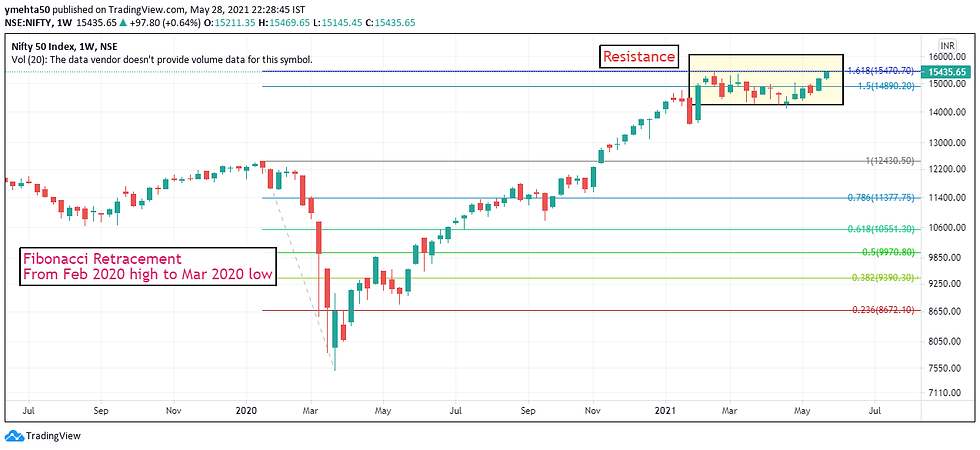
I have plotted this Fibonacci retracement from Feb 2020 high to Mar 2020 low. I got some important levels after that and as one can see Nifty faced resistance exactly at 161.8% of this (around 15470) levels and went into the consolidation phase for 4 months. This can be done on any stock if price entered uncharted territory. I will cover this Fibonacci retracement setup in our Technical Analysis series.
Currently Nifty is bullish and in uncharted territory. We can see higher levels in coming days and Nifty can face resistance at around 16070 as per Fibonacci retracement.
BankNifty
Daily time frame chart:

Banknifty has formed rounded bottom, and it had given breakout. Retest to this supply zone is completed, and it had become demand zone now. As pet this setup, one can expect target of 38300 in the short term. This breakout will fail if BankNifty closes below 34400.
This is broad based rally and more and more sectors are becoming bullish. Earlier Nifty was moving up because of financial sectors but now other sectors are turning positive.
Some sectors that are looking good for short term and positional trades are:
Nifty Auto
Nifty Bank
Nifty Commodities
Nifty Energy
Nifty Fin Service
Nifty FMCG
Nifty Infra
Nifty Media
Nifty PSE
Nifty PSU Bank
Nifty Pvt Bank
Nifty Realty
Currently, market is bullish and one can use buy on dip opportunities in the short term to buy good stocks among these sectors.
Let's see some chart of Nifty 50 and BankNifty constituents.
Reliance (Daily chart)

Reliance has given breakout above supply zone on the last day. One can start buying this on dips with stop loss: 1955 and target: 2230. Let it come down a bit and then buy to make risk reward more favourable.
ITC (Daily chart)

ITC trying to break the resistance line. If we get close above 214 with volumes, then it would be a breakout. Stop loss would be 206 and target would be 253 in short term.
Kotak Bank (Daily chart):

Kotak bank gave triangular pattern breakout. Good to accumulate for short term. Stop loss would be 1700 and target can be 1940.
Grasim (Daily chart)
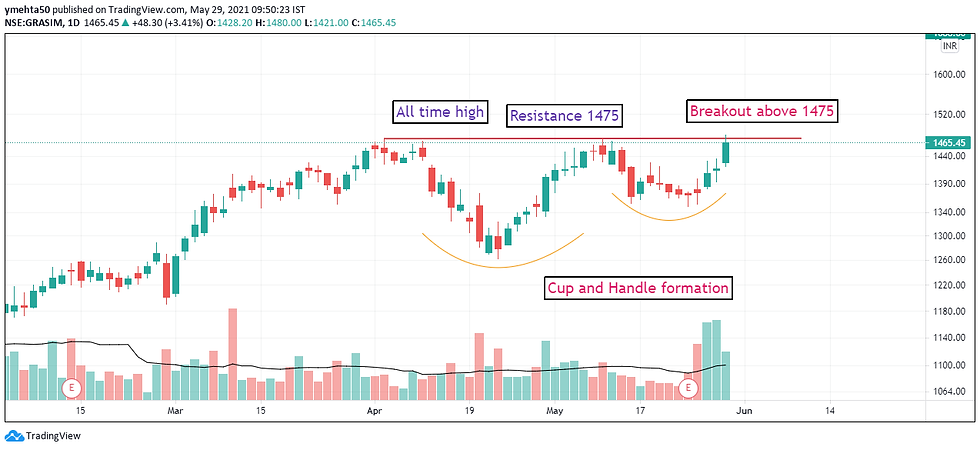
Grasim is trading near its all-time high. It has formed cup and handle pattern which is a continuation pattern and after breakout price continues its upward journey. One can start accumulating at CMP before breakout or can wait for breakout to happen above 1475. Stop loss would be 1345 and target would be 1688.
I am sharing these charts only for study purpose. One can track these stocks for short term perspective. Plan your trade with proper stop loss and target and then take action.
I will share more chart other than this on our YouTube channel and will show to calculate target price and time duration of holding. So you can subscribe to the YouTube channel.
Also, if you have any chart that we can track then share it with us in the comment section.
Conclusion:
Currently, market is looking bullish as it has broken resistance and supply zone. Short-term sentiments are bullish and one can use buy on dips opportunity in short term.
One can master this simple art of Technical Analysis by reading these blogs and practicing daily.
Readers can checkout and read first three blogs of Technical Analysis here:
Thanks for giving your precious time in reading this blog. I hope I have added value to your market analysis for next week. Like and share with others too if we can create value for others.
Publishing your analysis on public forum is not that easy. If analysis goes wrong, then you will have to hear negative comments of the people. Till now I have shared market analysis in last four weeks and the analysis was precise and worked well. If you like our analysis then just hit the Like that is there at the bottom of the blog so that we will know how many people are finding it more useful in their analysis. It also serves as a motivation for us to share more analysis blogs with our friends.


As expected another master piece, this blog really helps to plan the week ahead if you are serious in market. Well done. Much appreciated for your time Yash and dedication to produce quality content like this.