Market analysis for next week
- The Shareholder
- Jul 17, 2021
- 3 min read


In the last week's Market Analysis we have discussed that Nifty was trading in a tight range for few months now and one can expect volatility. Nifty has given breakout above previous all time high level.
Nifty is down by 1.5% and BankNifty is flat and up by 1.9% in last week.
I had shared one undervalued stock video in last week. It is giving opportunity to traders and investors. Stock has given breakout after three years and now completing its retest.
One can check the video and understand the rationale behind picking this stock.
Don't forget to subscribe to our channel and like the video.
Now let's see what can happen in Nifty, BankNifty and broader market for next week. Some charts of the constituents are also shared at the end as a bonus for all the readers, so read until the end.
We won't be looking at weekly chart as the support is currently far from current market price.
Nifty weekly support is 13600 and BankNifty weekly is 29000.
Nifty
Daily time frame chart:

Nifty was trading in range (15630 - 15915) for one month. Recently, Nifty has given breakout above resistance 15915 and now taking support at same resistance line. Short-term traders can use this opportunity to buy stock or Nifty bees. After this breakout, the target for Nifty is 16200 on the basis of range calculation. One can keep Stoploss at 15600 in the short term.
BankNifty
Daily time frame chart:

BankNifty has given breakout above supply zone (35650-35800). Now it is sustaining above this supply zone which will now act as demand zone in the future. I have already shared few banking stocks on twitter that can be tracked for short term. Link of that post: Twitter
After this breakout, the target for BankNifty is 37750 on the basis of range calculation. One can keep Stoploss at 34800 in the short term.
Some sectors that are looking good for short term and positional trades are:
Nifty Realty
Let's see some chart of Nifty 50 and BankNifty constituents.
Axis Bank (daily chart):

Axis bank has given breakout and now taking support at resistance line. It is cup and handle breakout and based on this pattern, target seen is 940. Stoploss would be 730.
ICICI Bank (daily chart):
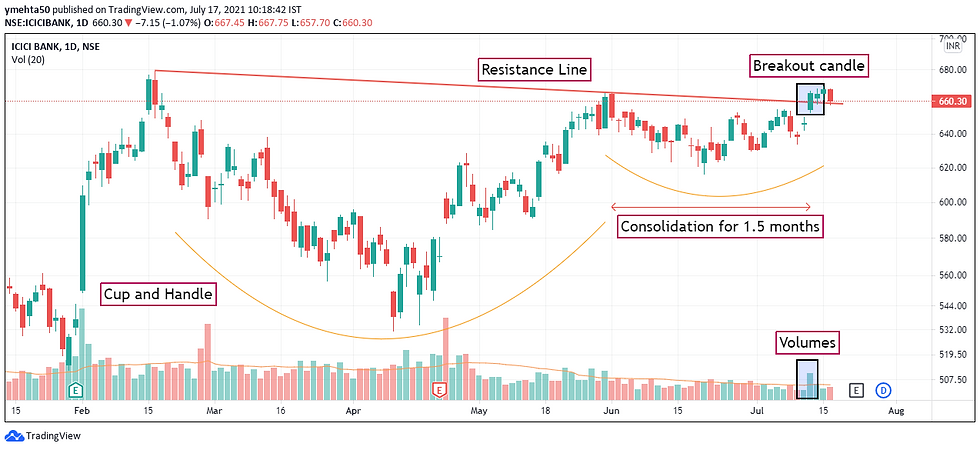
ICICI bank has given breakout and now taking support at resistance line. It is cup and handle breakout and based on this pattern, target seen is 808. Stoploss would be 630.
Disclaimer: I am sharing these charts only for study purpose. One can track these stocks for short-term perspective. Plan your trade with proper stop loss and target and then take action.
Also, if you have any chart that we can track then share it with us in the comment section.
Conclusion:
Nifty and BankNifty have given breakout last week. Some stocks in this index can be tracked for short-term gains.
One can learn this simple art of Technical Analysis by reading following blogs and practicing daily.
Readers can checkout and read first three blogs of Technical Analysis here:
Thanks for giving your precious time in reading this blog. I hope I have added value to your market analysis for next week. Like and share with others too if we can create value for others.
Don't forget to give a Like to this blog if this has helped you. It serves as a motivation for us to share more analysis blogs with our friends.


Comments