Technical Analysis - Demand and Supply
- Yash Mehta

- Apr 25, 2021
- 7 min read
Updated: Oct 31, 2021

Thank you guys for an overwhelming response on our second post on Identifying Trend in Market. If you haven't read the blog yet, then I would suggest to skim through it once.
Before starting with next blog on Identifying Demand/Supply, which is also called as Support/Resistance, let's summarize and revise what we have read in the second blog.
We discussed three types of trends that happen in the market, which are: Bullish or Uptrend; Bearish or Downtrend and Consolidation.
Let's begin now with the main agenda:
We will mainly focus on candlestick charts, as it is widely used by traders. But the definition and concept of support and resistance will remain same for other type of charts like Bar, Line, Heiken Ashi, Point & Figure, etc.
Demand Region:
Demand Region is a price level where a downtrend can be expected to pause due to a concentration of buying interest. As the price of assets or securities drops, demand for the shares increases, thus forming the support line. The demand region is always below the current market price.
How to draw Demand Region:
It should be horizontal (0°)
It should touch atleast 2 low points on chart or candle body's open/close
Try to connect as many lows of the candlestick or candle body's open/close
Try to connect where maximum points coincide (It will be most probable support)
Price should bounce or move up after hitting that region
Lets see live chart

This is Bharti Airtel Monthly Time frame chart. After touching the demand region, price had bounced back and went up. It provides low risk buying opportunities for the buyers in short term or long term.

Another chart is SBIN monthly chart. This is how price reacts near this demand region.
As of now, I have monthly charts of both the stocks just for educational purpose but Supply and Demand works on any time frame. Try to use on hourly, daily, weekly or month time frame. It will give good accuracy and proper setup for your trades.
Hold on this is one possibility where price moves up after reaching near Demand Zone. Second possibility is what if price goes below the demand zone?

Reliance Communication (RCom) chart is an amazing example of price breaking below the demand zone (45-50). After breaking we all know the current price of RCom which is 1 i.e. 98% wealth
Price closing below demand region is an exit alert signal for the buyers who are holding that stock and sell their position. There might be a chance that stock can go down further and will give you losses. Some exception cases is price give false close below Demand Region and then it moves up. In that case, wait for closing above demand region in that particular time frame and buy again. You will have to bear some loss plus some charges, but it's still better than to bear huge losses in such a case.
Let's see a live example of fake closing below demand zone.

Pidilite daily time frame chart. It gave false break down below demand region because of which buyers had exit. But after few candles, price had close above the same demand region and buyer would have entered again in this scenario. If we check this case, then those who had longs would have exited at 765 and bought back at 815 which is a notional loss of around 7% v/s big disaster if stock turned out to be a wealth destructor.
This was all about how to draw Demand Region and how to trade or exit based on different scenarios.
Supply Region:
Supply Region is a price level where an uptrend can be expected to pause due to a concentration of selling interest. As the price of assets or securities rises, supply for the shares increases, thus forming the resistance line. The Supply region is always above the current market price.
How to draw Supply Region:
It should be horizontal (0°)
It should touch atleast 2 high points on chart or candle body's open/close
Try to connect as many highs of the candlestick or candle body's open/close
Try to connect where maximum points coincide (It will be most probable resistance)
Price should move down after hitting that region
Lets see live chart

I have got same Bharti Airtel monthly chart example for supply region since it was in consolidation for 12 years. After touching the supply region, price had gone down. It provides low risk shorting opportunities for the sellers or bear in short term or long term. As shorting is possible only in futures or options and can require huge capital and high risk so we will focus only on buying side. So a trader who has a long position in this stock can exit or sell the position near the supply region and wait for the price to go down and then reenter.

Another chart is SBIN monthly chart. This is how price reacts near this supply region.
Hold on this is one possibility where price moves down after reaching near supply Zone. Second possibility is what if price goes above the supply zone?

Pidilite daily chart is a perfect example of price closing supply region (612-638). After breaking that stock price continue to head higher. In that chart itself we can see an upmove of 20% in 2.5 months.
Another interesting example of breaking of this supply on higher time frame chart.

Hindustan Unilever month chart. After breaking supply region (303-323) in 2011 price of the HindUnilvr went up from 343 to 2300; 570% returns in 10 years, which means Compounded Annual Growth Rate (CAGR) of 21%. This is one of the simplest way for an investor or long term positional trader to compound their capital.
Price closing above supply region is a good sign for traders and investors who can buy the underlying. Some exception cases is price give false close above Supply Region and then it moves down. In that case wait for closing below that same supply region in that particular time frame and exit your longs. You will have to bear some loss plus some charges but it's still better than to bear big losses if stocks go down.
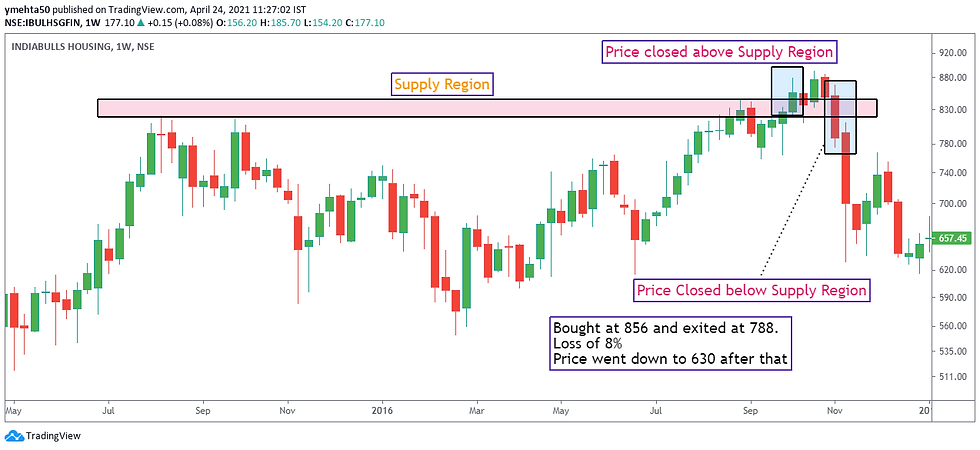
IndiaBulls Housing weekly frame chart. It gave false close above supply region because of which buyers had entered at 856. But after few candles, price had close below the same supply region and buyers have to exit their positions in this scenario. If we check this case, then those who were long at 856 would have exited at 788 thereby bearing a loss of 8% and after that stock went down to 630 which is a loss of 27%. There might be a case that after closing below the supply region price consolidate move up again above supply region, then a trader can enter again with same rules.
This was all about how to draw Demand Region and how to trade or exit based on different scenarios.
We have learnt about basics of these supply and demand now taking it to next level.
If a price breaks demand region and closes below, then that demand region will become supply region in the future. Let's understand this on chart.

As you can see, this is an example of Yes Bank weekly chart. After hitting demand turned supply region price of the Yesbank crashed from 266 to 50; down by 81% in 6 months. Sometimes market gives an opportunity to exit again if trader earlier didn't because of fear so use this opportunity to exit and protect your capital.
If a price breaks supply region and closes above, then that supply region will become demand region in the future. Let's understand this on chart.

This is an example of DMart weekly chart. After hitting supply turned demand region price of the DMart rallied from 1700 to 2600 twice; returns of 40%. Sometimes market gives an opportunity for buyers to enter again and buy that stock if trader earlier didn't so use this opportunity to buy the stock and ride the trend.
This was the simple hack about these demand and supply zone and therefore never erase historical demand-supply region from the chart because it can help you in the future.
Now everyone would be wondering what if price move above and below supply and demand region frequently and it will cause frequent buying and selling by traders and thereby churning cost. So as a trader or investor should keep one rule in mind; if you are not getting profit is fine, if you are facing minor losses is fine, if you are sitting on cash is fine but if you are holding a wrong position that is giving signal of moving against you then it's a serious problem and it can give a dent on your capital. Compounding is eight wonder of world and it can create wealth for you but Reverse Compounding is a destructor and can take you financially backwards by many years. If you have a loss of 50% then you will have to get 100% return on that capital to regain your capital back. I am not even counting about the time lost in that and the opportunity cost.
There are only four possibilities in Stock Market:
Big Profit
Small Profit
Small Loss
Big Loss
First three depends on market and it will be part of your trading but fourth one (Big Loss) is difficult to manage psychologically and it should be cut early in (Small Loss) phase so that your capital is protected.
I will end this long blog here and will cover Support, Resistance and Trendline in the next blog as it is also linked to this. As I said earlier, reading this blog and understanding this is a very small part and the major part is in practice. There are so many stocks listed on which you can practice in your free time. If you want, you can share your charts in comment section or DM me on Twitter, Whatsapp and LinkedIn. I will respond to everyone and we will learn together in this.
Also remember this are my rules that I follow while doing analysis and you have full right to disagree with this. In that case I will be more happy if you create your rules, see how it works on the chart and share with all of us so that I can also learn from you.
If there is something that I can improve upon, then please suggest that too so that I can create true value in this Technical Analysis Series.
Thank You Readers for using your precious time in reading this blog. Like and Share with others too and let's create value for others too who are new in Equity Market and want to learn.


Thanks for the Post Yash, Nice one. "Compounding is eight wonder of world and it can create wealth for you but Reverse Compounding is a destructor and can take you financially backwards by many years." is something every beginner will experience. I am holding ITC at 227 and ONGC at 125 from 2 Years and blocking capital. If I would have cut my loss early , would have found some good trades to cover up
Hats off to your efforts for taking out time to explain things such beautifully.