Technical Analysis - Resistance and Support
- Yash Mehta

- May 16, 2021
- 7 min read
Updated: Sep 12, 2021

Thank you guys for your response and love on our last post on Demand and Supply and also for this series. If you haven't read the blog yet, then I would suggest to skim through it once.
Before starting with next blog on Identifying Support/Resistance, let's summarize and revise what we have read in the second blog.
Demand: It is the range at which price that was crashing will take a pause and will start moving upward.
Supply: It is the range at which price that was moving up will take a pause and will start moving downward.
If price breaks this demand or supply region, then trend in the stock continues and previous demand or supply region becomes supply or demand region in the future.
Our new topic on support and resistance is continuation and subset of supply and demand regions that we have studied in last blogs. But methodology to identify correct support and resistance is important and we will learn it in this blog.
Let's begin now with the main agenda:
We will mainly focus on candlestick charts, as it is widely used by traders. But the definition and concept of support and resistance will remain same for other type of charts like Bar, Line, Heiken Ashi, Point & Figure, etc.
Support and Resistance are widely used by the traders instead of Supply and Demand. Both of them have its own important in Technical Analysis. Generally Demand-Supply is an area on charts whereas Support-Resistance is a line. Definition of the both the term remains the same but how to draw Support and Resistance is important.
Support:
Support is a price level where a downtrend can be expected to pause. As the price of assets or securities drops, demand for the shares increases, thus forming the support line. The support line is always below the current market price. Buying at support or demand zone offers low risk opportunities to the buyers.
How to draw Support Line:
It should be horizontal (0°) or slanted- keep maximum angle of 45° anticlockwise
Support Line must be upward sloping
It should touch atleast 2 low points on the chart or candle body's open/close
Try to connect as many lows of the candlestick or candle body's open/close
Try to connect where maximum points coincide (It will be most probable support)
Price should bounce or move up after hitting that region
Let's see live chart:

Nifty daily time frame chart. This can be an example of the horizontal support line. Price after touching the support line formed reversal candle pattern and had reversed.

DMart daily chart. If you see, the angle of the slanted support line is 14°. Support line is valid for maximum angle upto 45° so don't go beyond that. If you see price had bounced back every time it touched the support line. Personally I took this trade, shared it with others on Twitter and booked 50% gains in this. In TradingView or Investing.com platform, there is a tool to measure the angle of the support or resistance trendline.
Hold on, this is one possibility where price moves up after reaching near support line. Second possibility is what if price goes below the support zone?

Yes Bank monthly chart. Price had closed below the support line and after that price went down from 180 to 5 in few months.
Price closing below support line is an exit signal for the buyers who are holding that stock and sell their position. There might be a chance that stock can go down further and will give you losses. Some exception cases is price give false close below support and then it moves up. In that case, wait for closing above the same support line in that particular time frame and buy again. You will have to bear some loss plus some charges, but it's still better than to bear huge losses in such a case.
Let's see a live example of fake closing below support line.

Lic Housing Finance daily chart. Price had given close below support and then after next few candles price closed above the same support line. If we check, then buyer would have exited at 372 and bought back again 427. We have seen around 10% move after that. But the buyer had to incur a notional loss of 15% in selling and buying it again.
"Market is game of probability, and all this thing will happen. We just have to control our position to enter into big loss state."
This was all about how to draw Support Line and how to trade or exit based on different scenarios.
Resistance:
Resistance is a price level where an uptrend can be expected to pause. As the price of assets or securities rises, supply for the shares increases, thus forming the resistance line. The resistance line is always above the current market price. Selling at resistance or supply zone offers low risk opportunities to the sellers.
How to draw Resistance Line:
It should be horizontal (0°) or slanted- keep maximum angle of 45° clockwise
Resistance Line must be downward sloping
It should touch atleast 2 high points on the chart or candle body's open/close
Try to connect as many high of the candlestick or candle body's open/close
Try to connect where maximum points coincide (It will be most probable resistance)
Price should move down after hitting that region
Let's see live chart:

Nifty monthly time frame chart. This can be an example of the horizontal resistance line. Price after touching the resistance line formed reversal candle pattern and had reversed.

Nifty daily time frame chart. If you see price had bounced back every time it touched the support line. I have updated about this resistance line in market weekly analysis. Read it to understand what can be our trading plan for next week.
Hold on, this is one possibility where price moves down after reaching near resistance line. Second possibility is what if price goes above the resistance zone?

This is the same chart that we looked for resistance. Nifty monthly chart. Price has closed above resistance line and had given confirmation. After that, Nifty rallied from 6700 to 9000 in 11 months.
Price closing above resistance line is an opportunity for buyers in the market to buy that particular stock/index. Some of the trend following traders buy or invest in the stocks that are breaking its previous all-time high. It's believed that stock that is breaking all-time high is good company and buyers are willing to buy at higher levels as well. Most of the multibagger breaks all-time high and then rally.
Some exception cases is price give false close above resistance and then it moves down. In that case, wait for closing below the same resistance line in that particular time frame and exit the position. You will have to bear some loss plus some charges, but it's still better than to bear huge losses in such a case.
Let's see a live example of fake closing above resistance line.
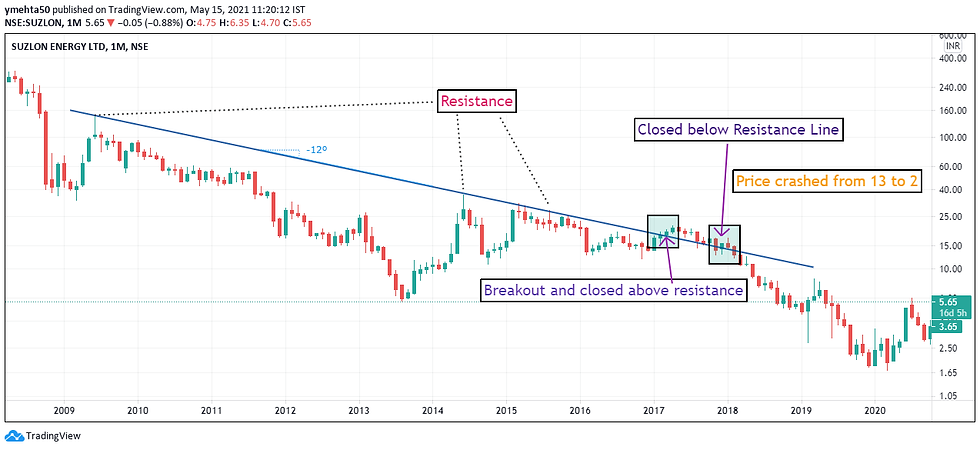
Suzlon monthly chart. Price had given closed above resistance line at 19, and then it closed below the resistance line after a few months at 14. Trader or investor would have lost around 26% in this. But that is still fine because after stock had crashed from 13 to 2, almost 85% crash. One has to minimize loss in the trading position.
This was the simple theory about resistance and support line.
Now some advance thing about support-resistance:
If price is testing support-resistance multiple time, then those lines will become psychologically weak and trader can expect a breakout or breakdown soon.
If price is consolidating below resistance line, then expect a breakout above it soon.
If price is consolidating above support line, then expect a breakdown below it soon.
This happens because of buying or selling pressure. There is some activity going on like accumulation or distribution below resistance or above support. If the price close above resistance or below support, then expect price to move in that direction. This logic can be applied for demand-supply region as well.
Current support line can become resistance in the future, and current resistance can become support in the future. It's just like Demand and Supply blog that we have learnt.
Looking at resistance-support in isolation won't work there has to be some reversal pattern that must form before final confirmation. This pattern can be easily understood from candlestick pattern. So next blog would be on Types of Candlestick and Candlestick pattern. We should combine both the things before executing our final trading plan.
I will end this long blog here as I said earlier, reading this blog and understanding this is a very small part and the major part is in practice. There are so many stocks listed on which you can practice in your free time. If you want, you can share your charts in comment section or DM me on Twitter, Whatsapp and LinkedIn. I will respond to everyone and we will learn together in this.
Also remember these are my rules that I follow while doing analysis and you have full right to disagree with this. In that case I will be more than happy if you create your rules, see how it works on the chart and share with all of us so that I can also learn from you.
If there is something that I can improve upon, then please suggest that too so that I can create true value in this Technical Analysis Series.
I am writing this blog and sharing everything that I have learnt. But the response on all three previous blogs was in descending order: Lesser likes and comments. Because of this I have lost interest in sharing these blogs. But on request of many friends, continuing the learnig again. If you are really interested to learn, then just give your like so that I will know that many readers are benefiting from these blogs.
Next blogs are ready, and I will publish that blog if I get 50 Likes on this blog. If you don't like this, then mention it in the comment section so that I can improve it more.
Thank You Readers for using your precious time in reading this blog. Like and Share with others too, and let's create value for others too who are new in Equity Market and want to learn.

Hi....you are doing a fantastic job.
Simple and very informative for novice like me, it cleared my concepts for Demand and supply, Thanks for sharing your experience..Keep up good work..
Good